
When the U.S. Supreme Court struck down portions of the Voting Rights Act today, it noted that the doomed section of the Act is no longer constitutional partly because the method of determining which states should be subject to it is outdated.
Here is the explanation in the opinion of Supreme Court Justice John Roberts:
At the time, the coverage formula—the means of linking the exercise of the unprecedented authority with the problem that warranted it—made sense. We found that “Congress chose to limit its attention to the geographic areas where immediate action seemed necessary.” Katzenbach, 383 U. S., at 328. The areas where Congress found “evidence of actual voting discrimination” shared two characteristics: “the use of tests and devices for voter registration, and a voting rate in the 1964 presidential election at least 12 points below the national average.” Id., at 330. We explained that “[t]ests and devices are relevant to voting discrimination because of their long history as a tool for perpetrating the evil; a low voting rate is pertinent for the obvious reason that widespread disenfranchisement must inevitably affect the number of actual voters.” Ibid. We therefore concluded that “the coverage formula [was] rational in both practice and theory.” Ibid. It accurately reflected those jurisdictions uniquely characterized by voting discrimination “on a pervasive scale,” linking coverage to the devices used to effectuate discrimination and to the resulting disenfranchisement.
Now consider this chart, organized by the Washington Post, based on data from the U.S. Elections Project for the presidential election of 2012. This indicates actual turnout.
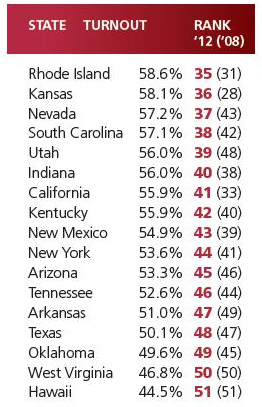
The national voter turnout rate in the election was 58.2 percent.
Using the Act’s formula, only one state — Hawaii — has a turnout rate 12 points lower than the national average. Meanwhile, Alabama, the state in which the county challenging the Act resides, had a voter turnout rate higher than the national average. So did, in fact, 34 of the 50 states.
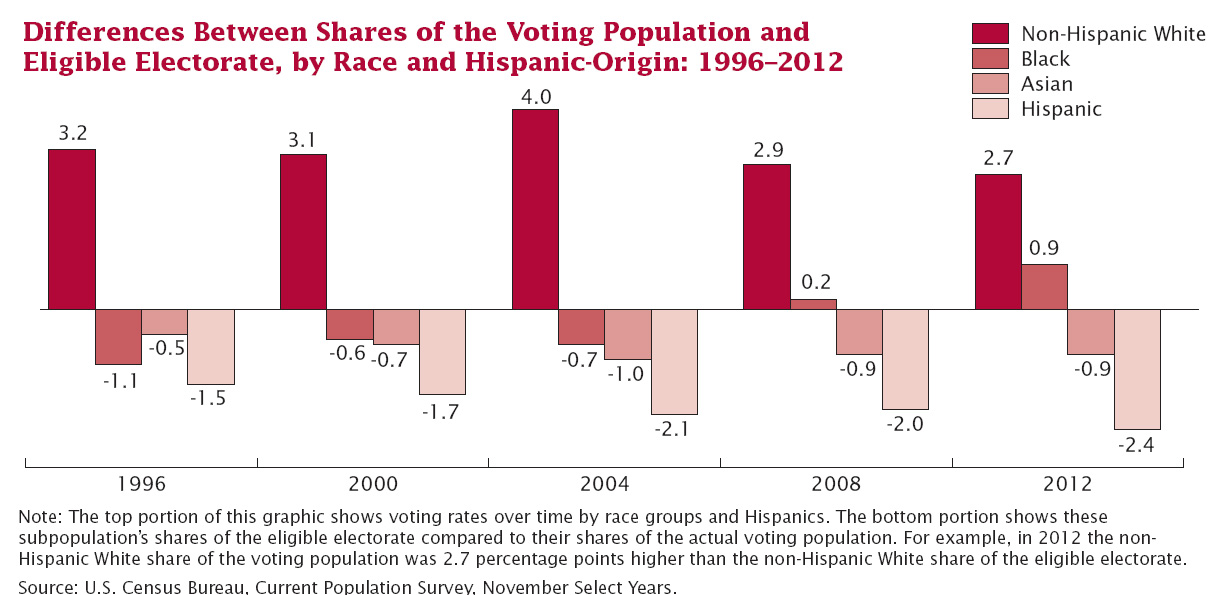
How does this compare with voter registration?
In 2012, Blacks voted at a higher rate (66.2 percent) than non-Hispanic Whites (64.1 percent) for the first time since the Census Bureau started publishing voting rates by the eligible citizenship population.
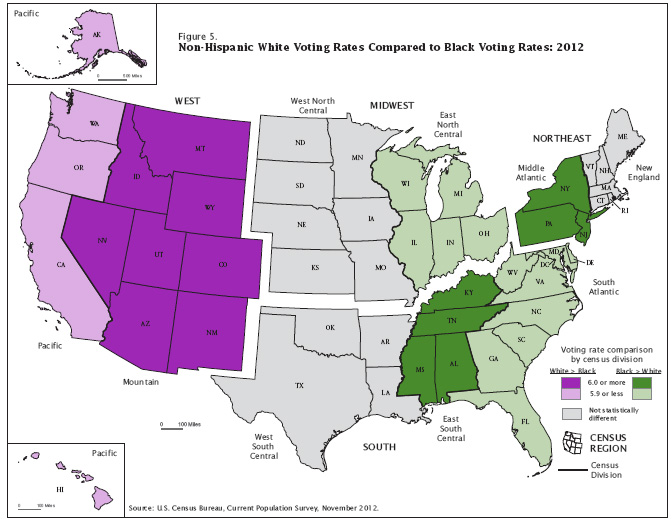
Broken down by Census Bureau divisions, registered blacks are more likely to vote than registered whites (see full report).
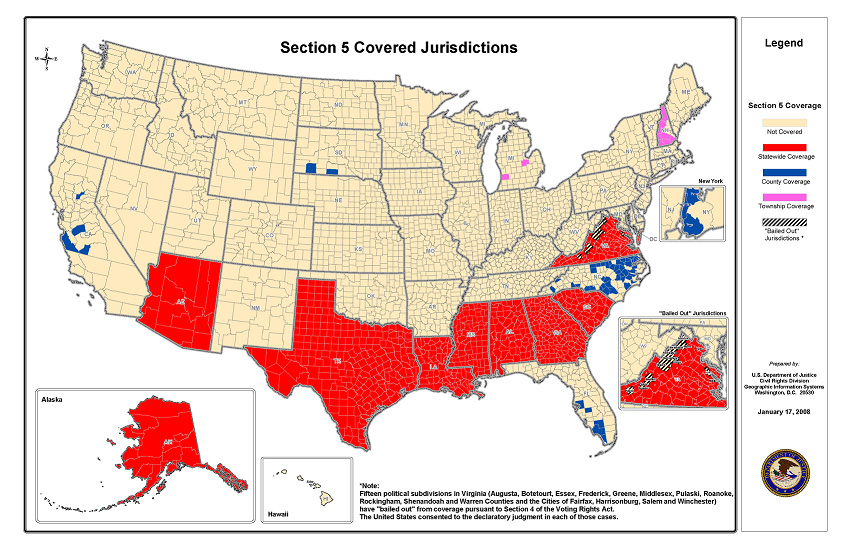
Now compare it to the map showing which states (shown in red) are covered by the section of the Act struck down today.
By almost any measure, that’s a success story and Justice Roberts acknowledged as much when he noted that it is probably due to the sections of the Act the court struck down today.
There are probably states now, based on the data above that should be subject to provisions of the Act, that currently are not. And the Supreme Court obviously invited Congress to consider doing that. The likelihood of that happening seems remote, given that the task of coming up with a definition to identify states with voter discrimination is hard and Congress has shown neither a willingness nor an ability to tackle hard issues.