
If you like playing with maps, and visualizing the extent of individuals’ economic woes, this is your lucky day.
The Administrative Office of US Courts has released state-by-state maps showing consumer bankruptcy filings. Minnesota, as you can see, has more than its share of bankruptcy filings compared to its neighbors, and many other states, too. Click on map for a larger view.
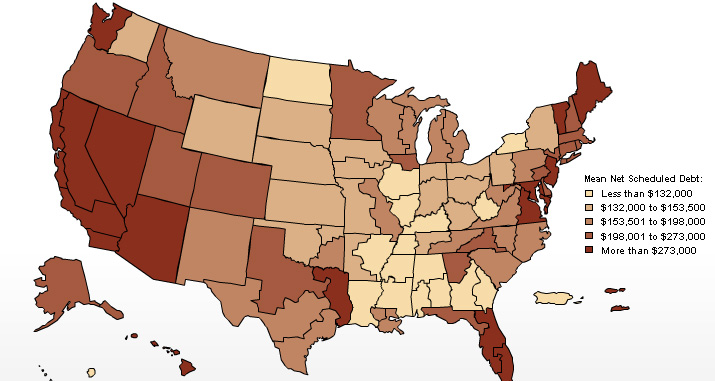
In Minnesota, the mean debt is about $244,000. The mean assets is about $160,000. “These figures are total debt, the bulk of which will be mortgage and auto debt, which debtors must pay if they want to keep their homes and cars,” the blog Credit Slips reports.
Auto loans? Here’s a map from the NY Fed on auto loans that are more than 60 days past due. Note that in Minnesota, the most frequent occurrence of bad debt in auto loans is outstate (blue is the highest percentage).
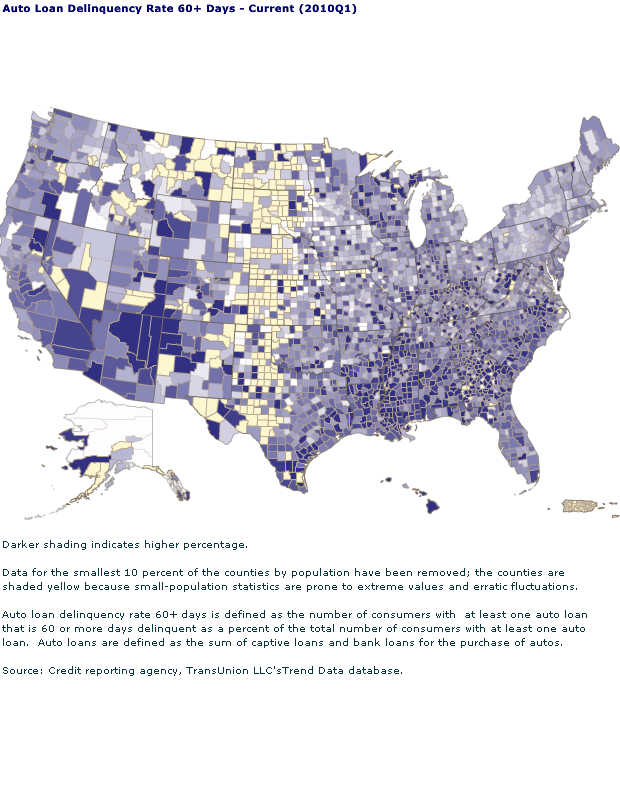
The situation is most severe in Minnesota in Pope, Grant, Beltrami, and Lake counties.
The Fed has several categories of maps available, including student loans, mortgages, and bank cards. But what we most want to know on subjects like this is “is it getting better.”
Here’s a map showing the year-to-year change in mortgages that are more than 90 days in arrears. Red indicates a worsening. In Minnesota, it’s worse.
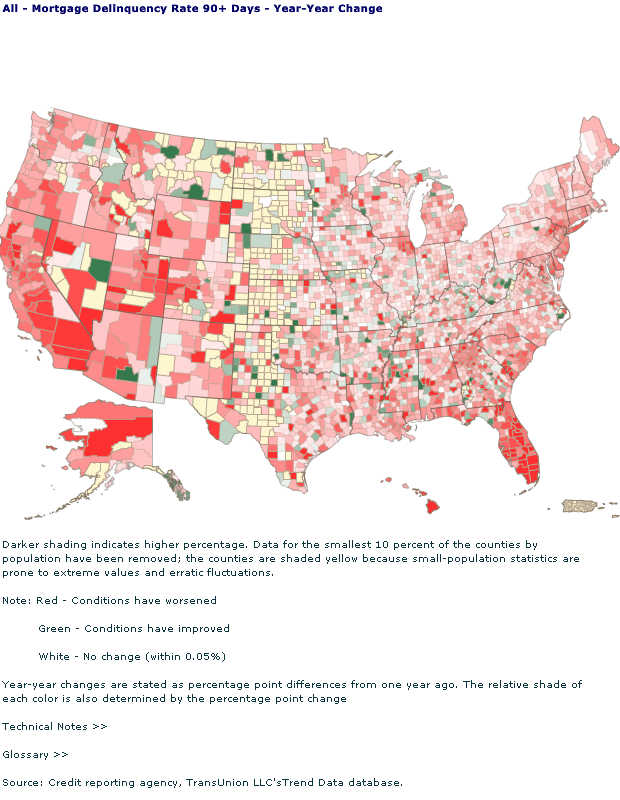
In fact, for most every segment, things were worse in the 1st quarter of 2010 than in 2009. The exception seems to be bank cards. In particular, Grant County in far western Minnesota, is the one county that stands out for the severity of debt problems. Nearly 9 percent of the population there lives below the poverty level.
You can play with the maps here.